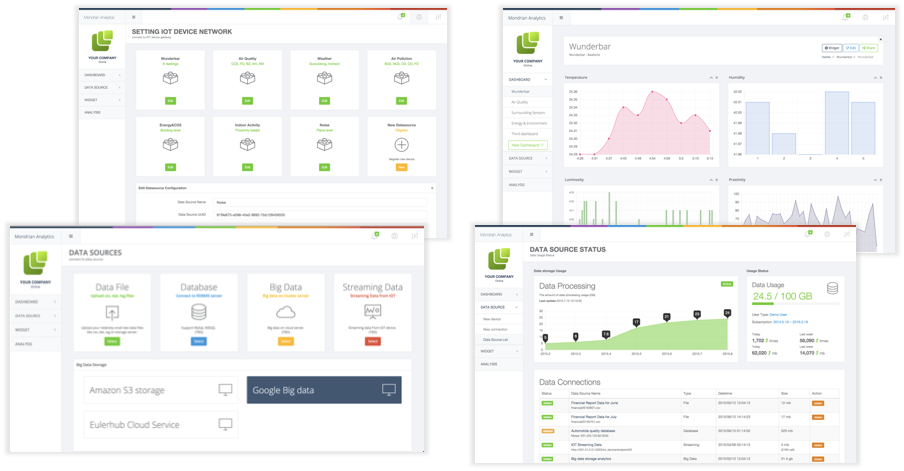
Business Intelligence Dashboard


Data Visualization
Bring data to life through data visualization. We design powerful intelligent dashboards that are capable of analyzing data from various industries. Monitor your organization's key performance indicator from a single dashboard.Mondrian AI is committed to helping companies in diverse fields such as finance, manufacturing, healthcare, and more discover value from their own data
Transform large-scale data from various industrial fields into a web dashboard
Check real-time analysis results, integrated with massive data, at a glance through the dashboard. It serves as a starting point where all team members can easily grasp the business status and discover valuable insights. We create a system to manage the flow of information, facilitating swift decision-making
Business Intelligence Dashboard
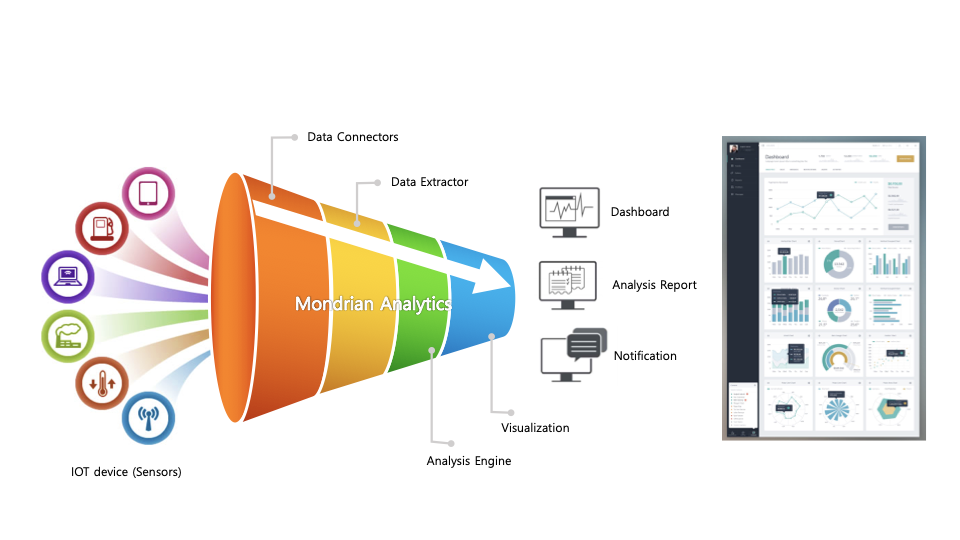
Handling machine data swiftly and effortlessly
We provide visual tools for exploring and analyzing customized big data for businesses. To collect and utilize machine data generated on a massive scale from IoT, conventional methods are inadequate. Integrate various storage solutions such as Hadoop, Spark, NoSQL DB, etc., and configure a dashboard that administrators can easily understand at a glance.
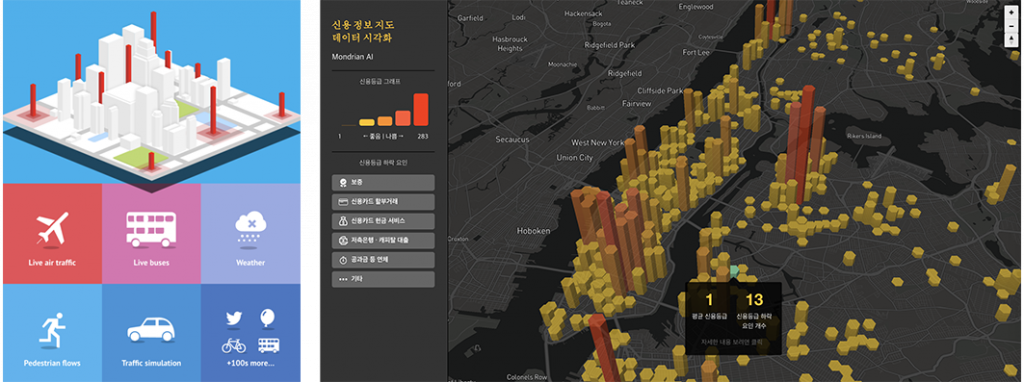
City Visualizer
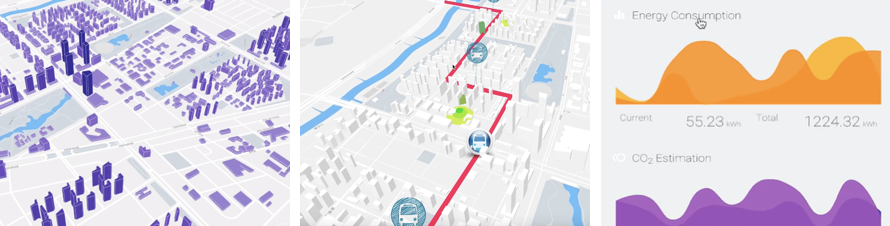
Through Mondrian’s urban data visualization technology, you can not only monitor key environmental indicators and the status of the city in real-time but also conduct monitoring using a 3D web browser.
Transform vast urban data into a masterpiece that can be appreciated at a glance!
We provide a form that allows anyone to easily and quickly understand complex and extensive urban data through the latest frontend technology and a user-centric design perspective.
Mondrian
City Visualizer
We simplify and express smart city data to the general public through the web in a simple and concise manner By analyzing complex real-time urban data through an integrated solution, we present a perspective of citizen participation in addressing urban issues, encouraging everyone to join in solving city problems.
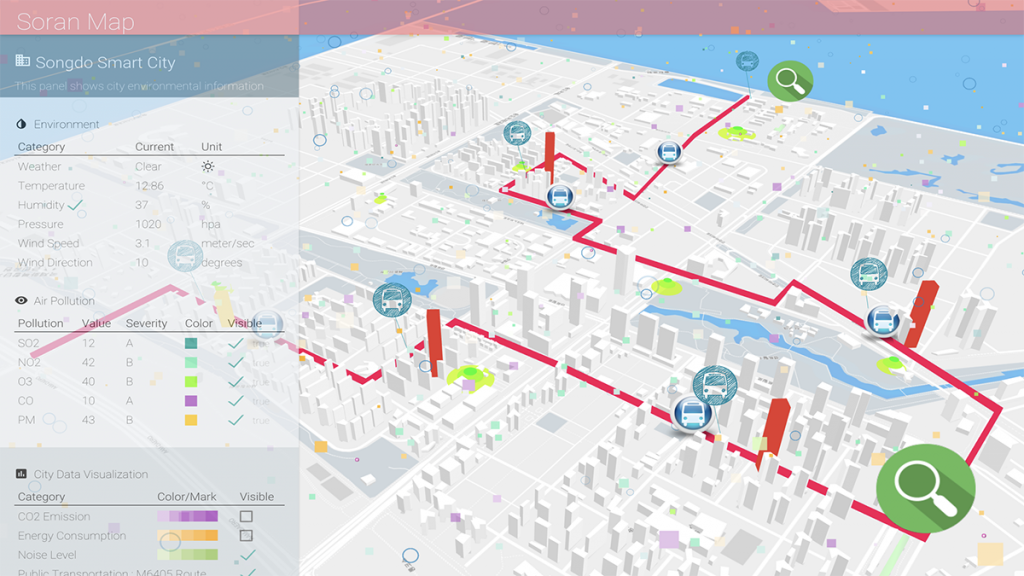
Real-time visualization of smart city data
We collect various data generated in the smart city and provide services that allow citizens to see it at a glance.
- City Environmental Information: Local weather, wind, humidity,
- temperature Building Information: Energy consumption, carbon emissions by building and region
- Urban Air Quality: SO2, NO2, O3, CO, PM10, PM2.5, etc.
- Bus/Vehicle Movement Paths, Parking, Stop Information
- Indoor Sensors: Congestion, indoor air quality, brightness, energy usage

Location-based data analysis and visualization
Share the results of analyzing data, including location information such as buses, bicycles, SNS, and pedestrian traffic, effortlessly through the web.